Chart Pattern Definition:
A chart pattern is a formation on a price chart that signals a potential market movement.
What Are Candlestick Chart Patterns
Candlestick chart patterns are formations that appear on price charts, typically representing the historical price movements of assets like cryptocurrencies. Traders and analysts use these formations to make predictions about future price actions, often relying on visual cues that indicate market sentiment. Such formations can be found in various time frames, and their analysis has roots in technical analysis that dates back to the early 20th century.
The study of trading chart patterns has gained popularity with the rise of trading platforms and the increasing accessibility of market data. These patterns help traders identify trends, reversals, and continuations, providing insights into potential buying or selling opportunities. While analyzing candlestick formations is not foolproof, it serves as a valuable tool in a trader's arsenal when combined with other indicators.
How Do Chart Patterns Work?
Candle chart patterns work by analyzing historical price movements to identify recurring formations that can indicate future price behavior. Traders use these formations to gauge market sentiment and make predictions about potential price movements. When a pattern is recognized, traders often place trades based on the anticipated outcome, such as entering a long position after a bullish pattern or a short position after a bearish pattern.
The effectiveness of a trader's analysis relies on several factors, including volume, timeframe, and market context. For instance, a breakout from a triangle pattern accompanied by high trading volume is often seen as a stronger signal than one with low volume. Additionally, traders may use additional indicators, such as moving averages or RSI (Relative Strength Index), to confirm signals generated by a candlestick chart pattern, enhancing the reliability of their trading decisions.
Bullish vs. Bearish Chart Patterns
Bullish chart patterns indicate potential upward price movement, providing traders with opportunities to enter long positions. These formations typically appear during price consolidations before the price breaks to higher levels. Examples include the bullish flag chart pattern, which forms after a strong upward movement and indicates a continuation of the trend, and the cup with a handle chart pattern, which suggests a gradual shift from bearish to bullish momentum.
On the other hand, bearish chart patterns signal downward price movements and are used to identify potential short-selling opportunities. formations like the double top chart pattern and head and shoulders chart pattern suggest that the price may reverse after reaching resistance levels. A reverse flag pattern chart can also indicate bearish market conditions.
Types of Chart Patterns
There are several distinct formations, each representing different market behavior. Some of the most common ones include:
Head and Shoulders chart pattern: This pattern signals a reversal in trend, typically indicating a shift from bullish to bearish. It consists of three peaks: a higher peak (head) between two lower peaks (shoulders).

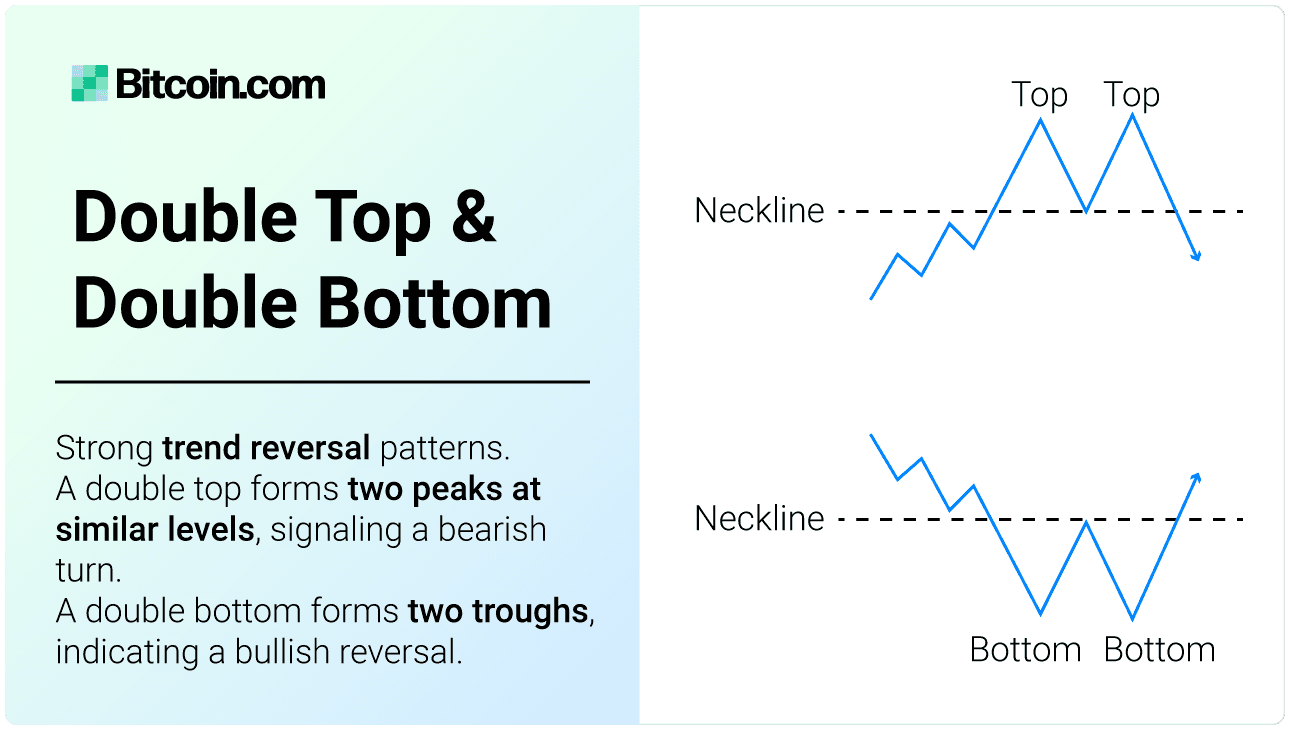
Double Top and Double Bottom: These suggest trend reversals. A double top pattern indicates a bearish reversal, forming two peaks at roughly the same price level, while a double bottom pattern indicates a bullish reversal with two troughs.
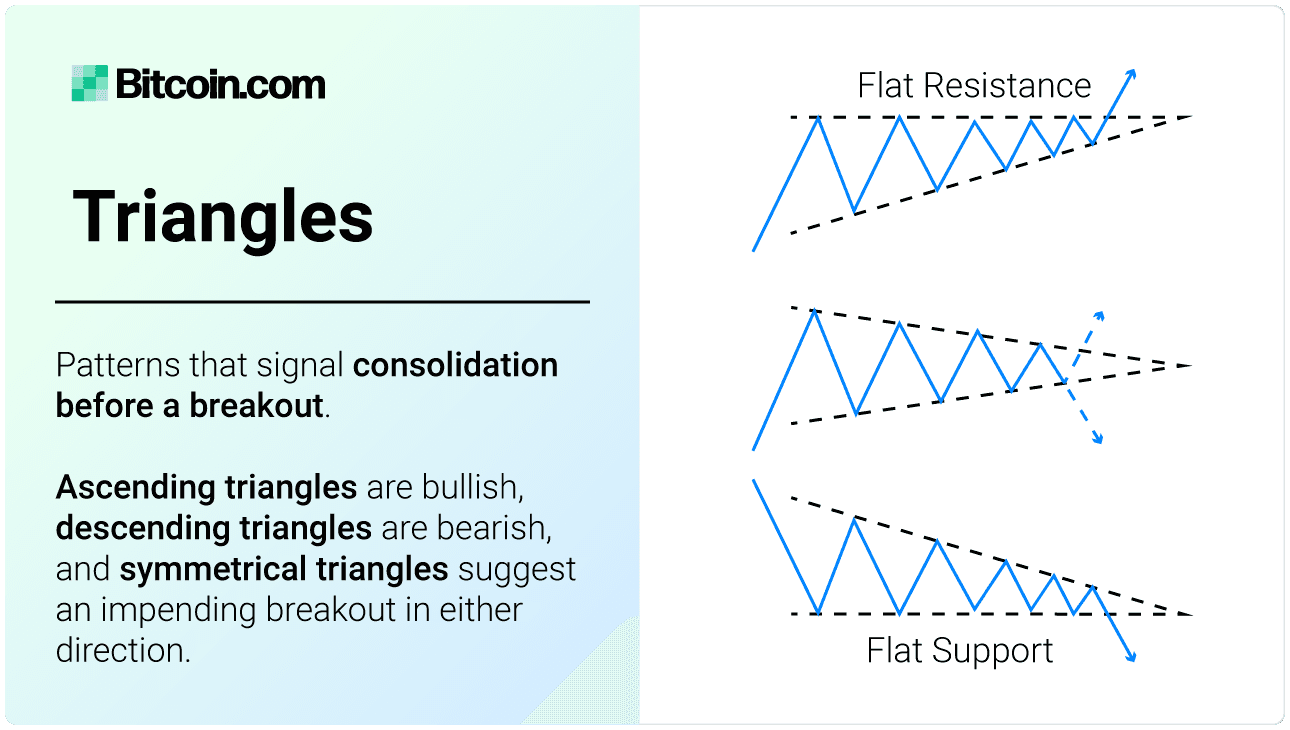
Triangles: These can be ascending, descending, or symmetrical. A price pattern forming a triangle indicates a period of consolidation before a the price breaks a resistance or support level, with the price action narrowing over time.
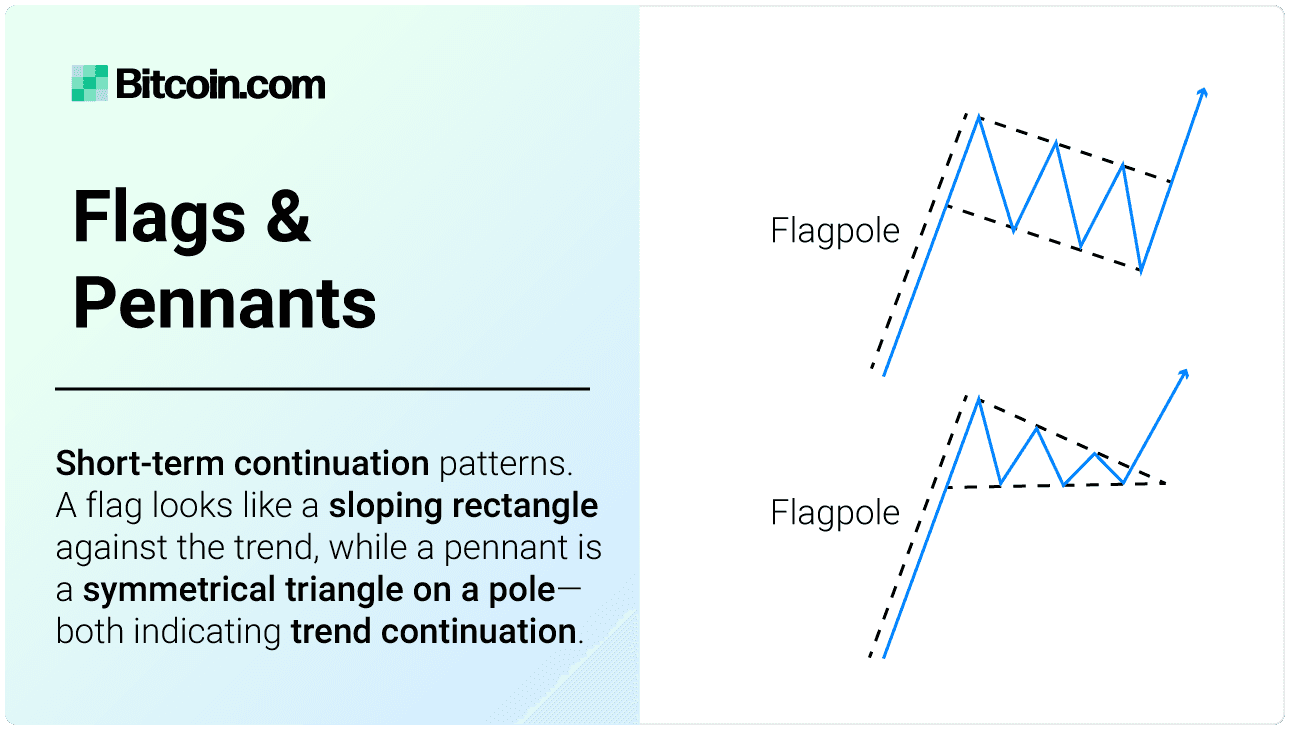
Flags and Pennants: Flags are short-term continuation indicators that resemble a rectangle and slope against the prevailing trend, while pennants are small symmetrical triangles that also indicate continuation of the previous trend. The bullish flag chart pattern is a strong indicator of continuation in an upward trend.
Cup with a Handle: This pattern resembles a cup with a handle, where the cup is a rounded bottom and the handle is a slight pullback before a breakout, typically signaling a bullish continuation.

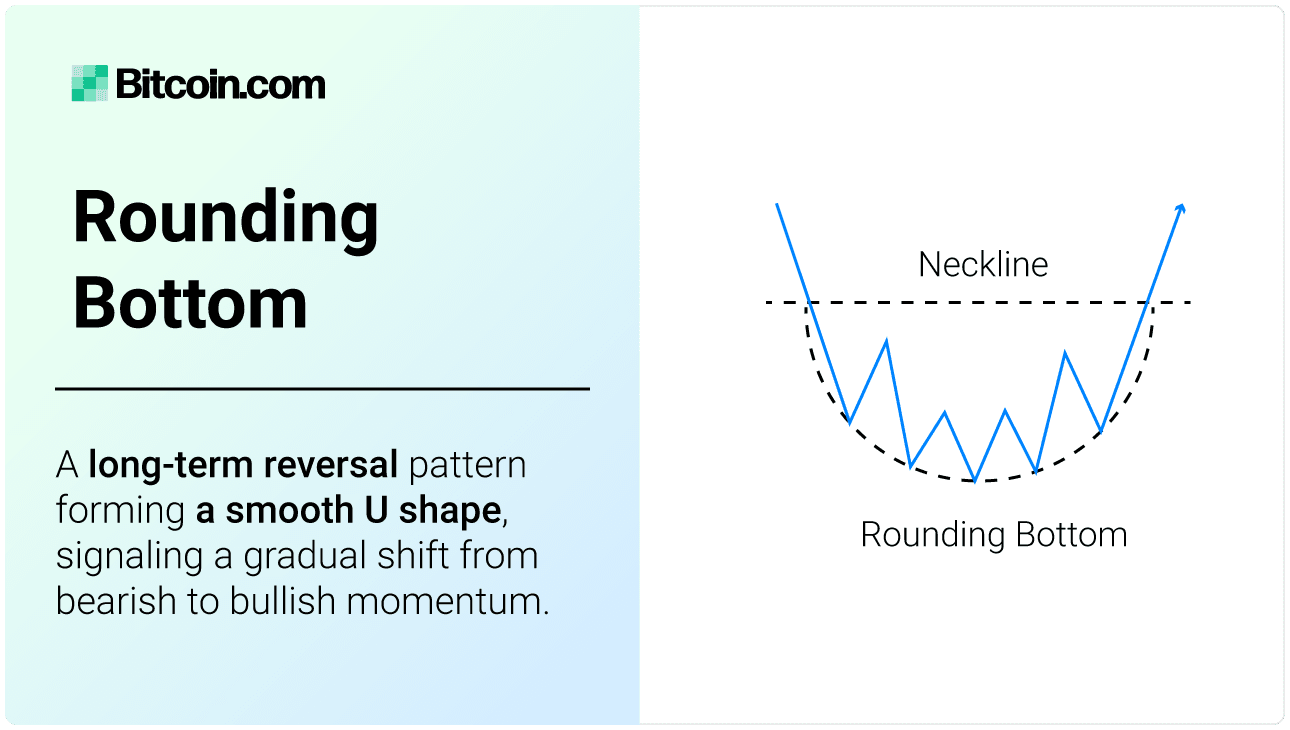
Rounding Bottom: This long-term reversal pattern resembles a "U" shape and indicates a gradual shift from a bearish to a bullish trend, suggesting a potential bullish reversal.
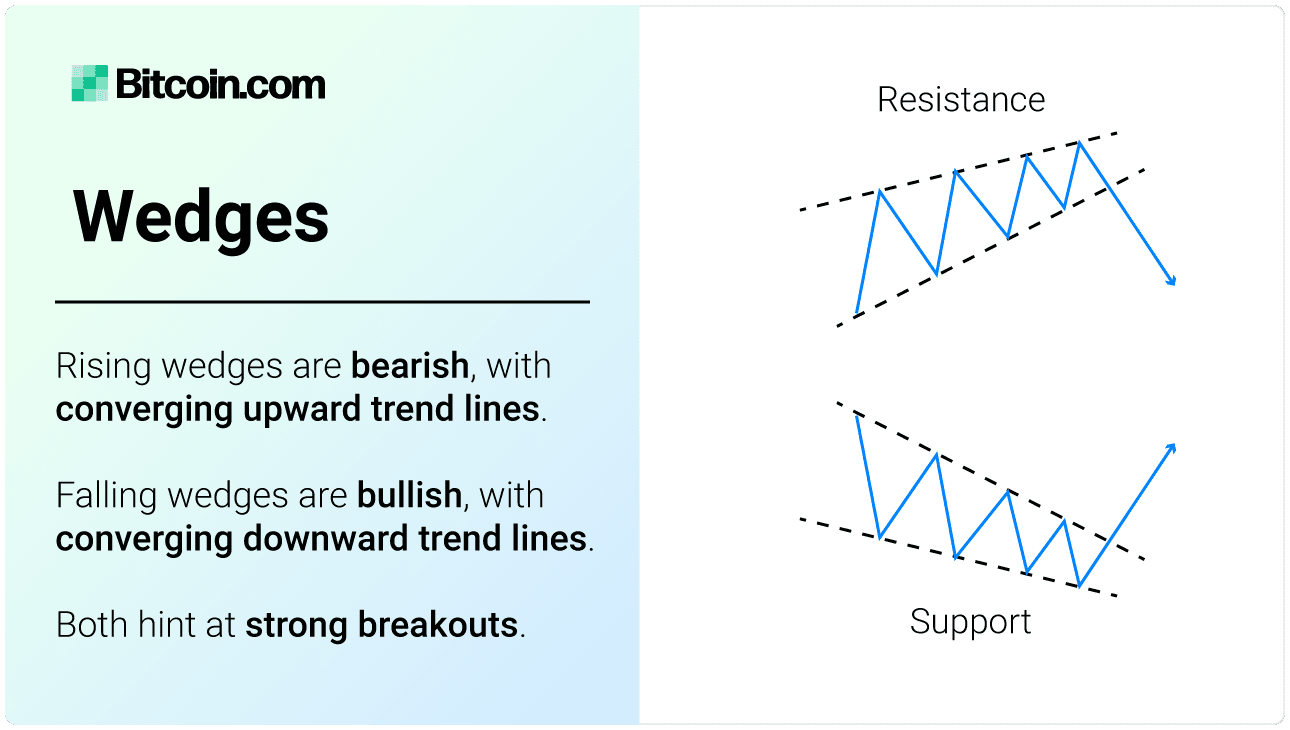
Wedges: Rising wedges are formed by upward-sloping converging trend lines and indicate a bearish trend, while bullish falling wedges are formed by downward-sloping converging trend lines.
Channel Patterns: Ascending channels are bullish patterns where the price moves between two upward-sloping parallel lines, while descending channels are bearish patterns where the price moves between two downward-sloping parallel lines.
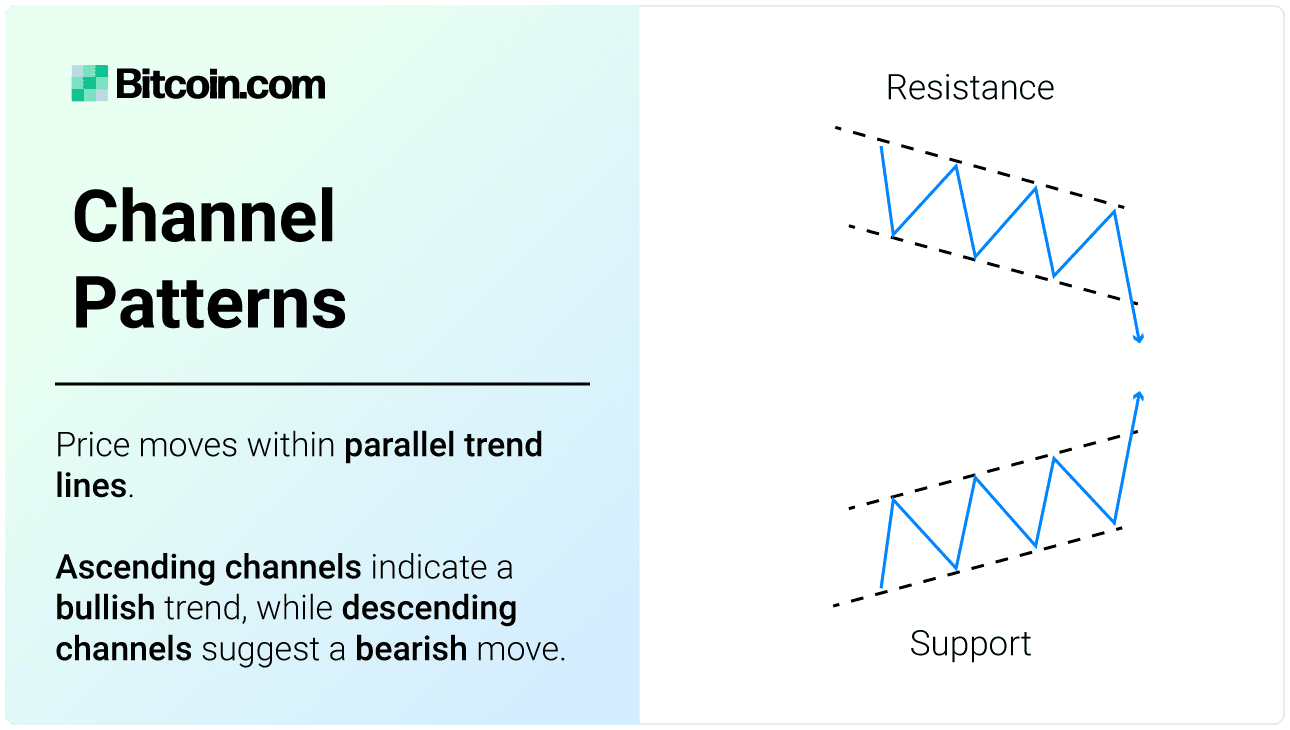
Chart Patterns Cheat Sheet
To streamline their trading process, many traders rely on a cheat sheet to quickly spot important formations. We've compiled a downloadable chart patterns cheat sheet that covers the most common pattern types, including guidance on optimal entry points and stop loss order placement. In some cases, traders may want place their stop loss orders closer to the entry point. The goal is to strike a balance between protecting your investments and avoiding unwanted stop loss execution due to price volatility.
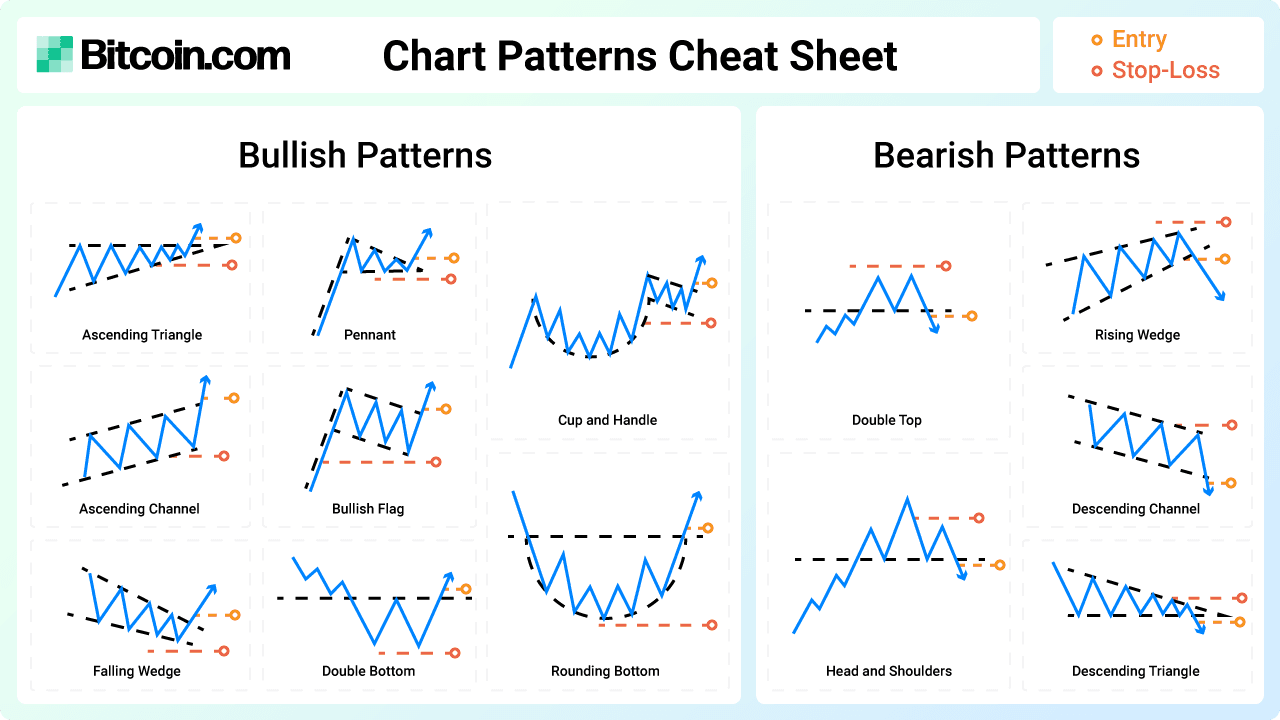
Bullish Patterns
- Double bottom: Common on daily and 4-hour charts. Entry above resistance line, stop-loss below troughs
- Falling wedge: Seen on 4-hour and daily charts. Entry above wedge breakout, stop-loss below pattern's low.
- Bullish flag: Seen on 15-minute to daily charts. Entry at breakout above flag, stop-loss below the flag's low.
- Cup with a handle: Found on daily and weekly charts. Entry above handle breakout, stop-loss below handle's low.
- Rounding bottom: Typically observed on daily and weekly charts. Entry after confirmation, stop-loss below prior swing low.
- Ascending channel: Found on daily and weekly charts. Entry after channel breakout, stop-loss below channel support.
- Ascending triangle: Found on hourly and daily charts. Entry after breakout, stop-loss below support level.
- Symmetrical triangle followed by a bullish breakout: Appears on hourly and daily charts. Entry after breakout, stop-loss below trendline.
Bearish Patterns
- Head and shoulders: Typically on daily and weekly charts. Entry below neckline, stop-loss above right shoulder.
- Double top: Seen on daily and 4-hour charts. Entry below support, stop-loss above peaks.
- Rising wedge: Found on 4-hour and daily charts. Entry below wedge breakdown, stop-loss above pattern's high.
- Bearish flag: Seen on 15-minute to daily charts. Entry below flag breakdown, stop-loss above flag's high.
- Descending channel: Seen on daily and weekly charts. Entry after channel breakdown, stop-loss above channel resistance.
- Descending triangle: Common on hourly and daily charts. Entry after breakdown, stop-loss above resistance line.
- Symmetrical triangle followed by a bearish breakout: Appears on hourly and daily charts. Entry after breakout, stop-loss above trendline.
Tools for Chart Pattern Detection
Modern trading platforms and tools make it easier to spot candlestick formations automatically. Platforms like TradingView, MetaTrader, and Coinigy offer pattern recognition plugins or built-in features that will highlight a pattern as soon as one appears on the price graph. These tools can save time and improve accuracy, especially for beginners still learning technical analysis basics. Additionally, mobile apps and browser extensions now alert users in real-time when a notable pattern is forming, allowing for faster reaction and more informed trades.
Chart Pattern Reliability and Limitations
While the technique is widely used for crypto trading, it's important to understand that no pattern guarantees a specific outcome. The reliability of a candlestick chart pattern depends on several factors: market conditions, timeframe, confirmation signals, and volume. For example, a double top pattern seen during low volume may lack strength, while the same pattern during high volume may be a stronger bearish indicator. Traders often wait for a confirmation candle or additional technical indicators (like MACD or RSI) before acting on a signal.
Patterns also perform differently across asset types and timeframes. A pattern that's effective for Bitcoin may not behave the same way on altcoins with lower market capitalization and liquidity. It's crucial to pair technical trading with solid risk management and not rely on them in isolation.
Bottom Line
Understanding chart patterns and technical analysis is essential for successful trading. By learning to recognize typical formations on trading charts, traders can improve their ability to predict price movements and make more informed decisions. Whether using crypto chart patterns for day trading or long-term investments, mastering these formations can provide a significant edge in the market.